A growing body of research on the benefits of early childhood education has put public funding for pre-kindergarten (“Pre-K”) in the spotlight across the country. With more total funding and more students served than ever before, it’s an exciting time for Pre-K education in America. Various mechanisms are used to fund Pre-K at the federal, state, and local levels. With each state taking its own approach, we are seeing an especially wide range of program offerings, percentage of students served, and funding levels across states. In this blog, we provide an overview of the complicated early childhood education funding landscape throughout the United States as we explore the following questions:
- How much US public funding is available for Pre-K education each year?
- How has the size of the publicly-funded Pre-K market changed over time?
- What are the major funding mechanisms that drive federal, state and local dollars into Pre-K programs?
- Why are there differences in program offering and funding levels across states?
A $24 billion-dollar market in 2015 and growing.
More 3- and 4-year-old students in the United States are being served by public programs than ever before, with enrollment in state-funded preschools alone topping 1.5 million students for the first time in 2017. In 2017 about 44% of 4-year-olds and 16% of 3-year-olds were served across all public programs 1, representing an increase of 13% and 2%, respectively, since 2002 (Source). Public funding for early care and education for 3- and 4-year-olds has also been steadily increasing, reaching ~$24B in 2015, and increasing each year since. While federal funds represented just 8% of the $649B total public funding for K-12 education in 2015, more than half of the ~$24B for Pre-K in 2015 came from federal sources.
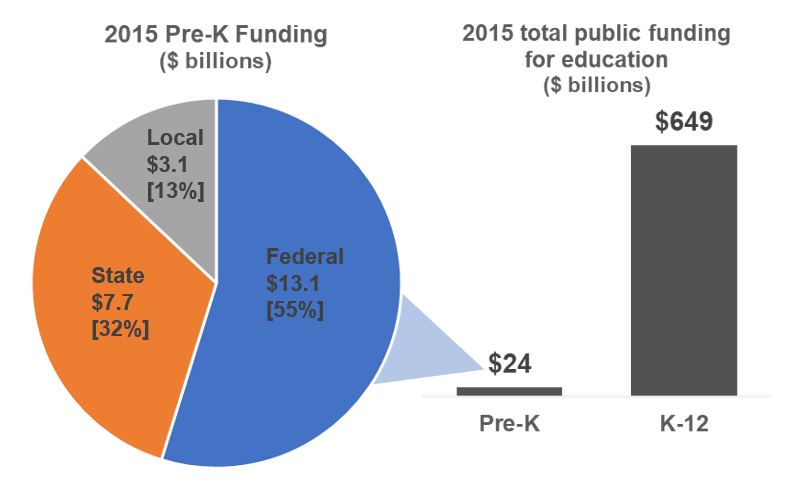
- Pre-K 2015 funding source: Funding Landscape for Preschool with a Highly Qualified Workforce, BARNETT & NIEER
- See source report page 21 for comparison of 2014 public funding of Pre-K vs. K-12 funding (by individual state)
- Noted caveat: “local contribution[s] to preschool programs more generally is largely unreported to states and difficult to estimate.”
FEDERAL FUNDING is growing, dramatically.
Pre-K programs have become more and more reliant on federal funds, which have increased dramatically over the past few years. While there are many different federal funding sources for early childhood, in total federal funding has increased 62% over the past ten years – from $12.7B in FY08 to $20.6B in FY19. The largest federal early childhood “programs”, as measured by FY18 funding levels, are Head Start and Early Head Start, Childcare and Development Block Grants, IDEA Part C Grants for Infants and Families, and IDEA Part B Preschool Grants. These programs’ FY18 funding levels totaled $9.9B, $5.2B, $470M, and $381.1M respectively, and represent an increase of about $3B over FY17, in total (Source). To better understand the progress over the past decade for federal funding by program, we found this report by The First Five Years Fund to be helpful.
STATE FUNDING varies greatly by state, and while it is growing in total, on average per pupil funding not.
States have the autonomy to fund early childhood programs in different ways, most commonly using 1) general fund appropriations, 2) block grants and/or 3) state funding formulas. Most state-funded Pre-K programs receive money through general fund appropriations, where states use the legislative budgeting processes (typically annually) to allocate general dollars toward priority initiatives – Pre-K being just one of many of these initiatives. Block grants tend to be used to target additional funds towards specific areas or programs serving students with high needs, but many states also use these grants to fund Pre-K. Finally, as of Feb 2018, nine states use their existing K-12 education funding formulas to fund Pre-K, and as The Education Commission of the States points out, “while K-12 funding formulas do not guarantee adequate levels of funding, money distributed through a formula is more insulated from the economic ebbs and flows of the state budget process.” (Source).
On top of the differences in state funding mechanisms, states can also choose the degree to which they fund Pre-K programs. Considering the full spectrum of state funding from fully funded Pre-K to no funding for Pre-K at all, we’ve found the four general categories used by the Education Commission of the States to be helpful:
- FULLY FUNDED, UNIVERSAL PRE-K: Two (2) states 2 and the District of Columbia have worked to provide truly Universal Pre-K programs, meaning that the sole criteria is age, and eligibility is not dependent on family characteristics such as income.
- MOSTLY UNIVERSAL PRE-K: Seven (7) states 3 offer pre-K with varying levels of universality. For example, “Oklahoma offers universal pre-K in almost all its districts, and West Virginia is in the process of expanding its program. Five other states (Georgia, Illinois, Iowa, New York and Wisconsin) also have pre-K policies that many consider to be universal.” (Source)
- NON-UNIVERSAL, STATE-FUNDED PRE-K: Thirty-Five (35) states offer some form of state-funded Pre-K but eligibility is restricted by factors such as family income or state spending caps.
- NO STATE FUNDING FOR PRE-K: Six (6) states 4 did not provide any Pre-K funding, relying on federal, local, and private funding to offer Pre-K programs.
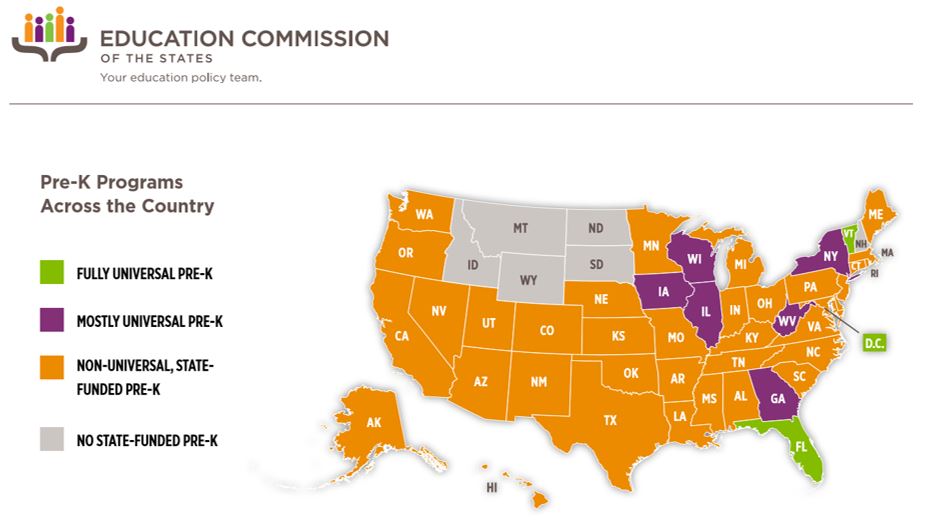
graphic and data source: How States Fund Pre-K, ECS
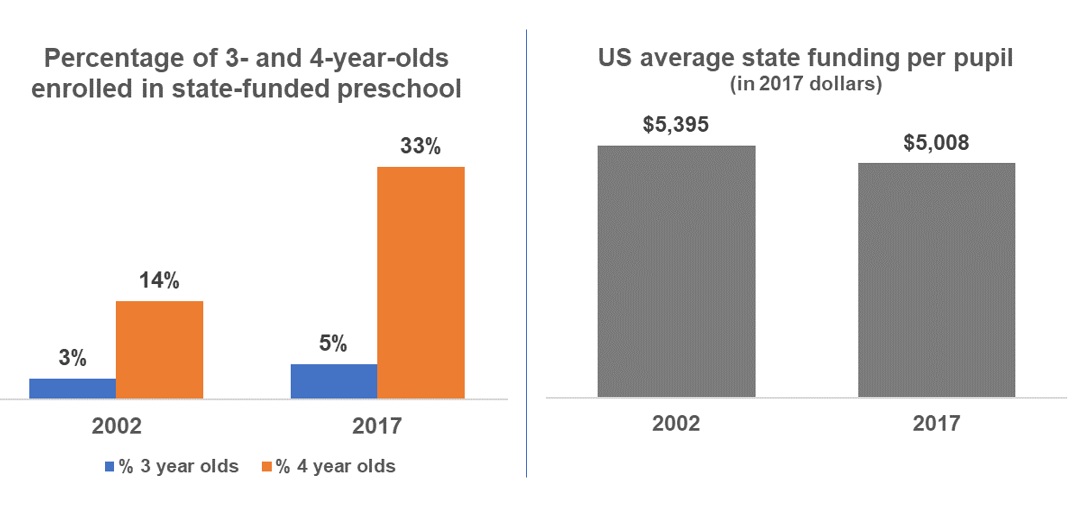
Over the past 15 years, while total state funding for Pre-K has increased by over $4 billion (inflation-adjusted dollars), on average funding per eligible Pre-K pupil across the US, also adjusted for inflation, has decreased. This decline in per pupil funding is driven in part by the record number of students that are being served, with over 1.5 million 3 and 4 year olds participating nationally in state-funded Pre-K in 2017 (Source, Source). In 2002, 14% of 4 year olds and 3% of 3 year olds were enrolled in state-funded Pre-K, while in 2017 these percentages jumped to 33% and 5% respectively. State Pre-K spending across the country increased from $2.4 billion in 2002 to over $7.6 billion in 2017, but it hasn’t kept pace with inflation and the spike in enrollment. On average, states spent $3,458 per pupil in 2002 ($5,395 in 2017 dollars) but in 2017 this number decreased to $5,008 (Source).
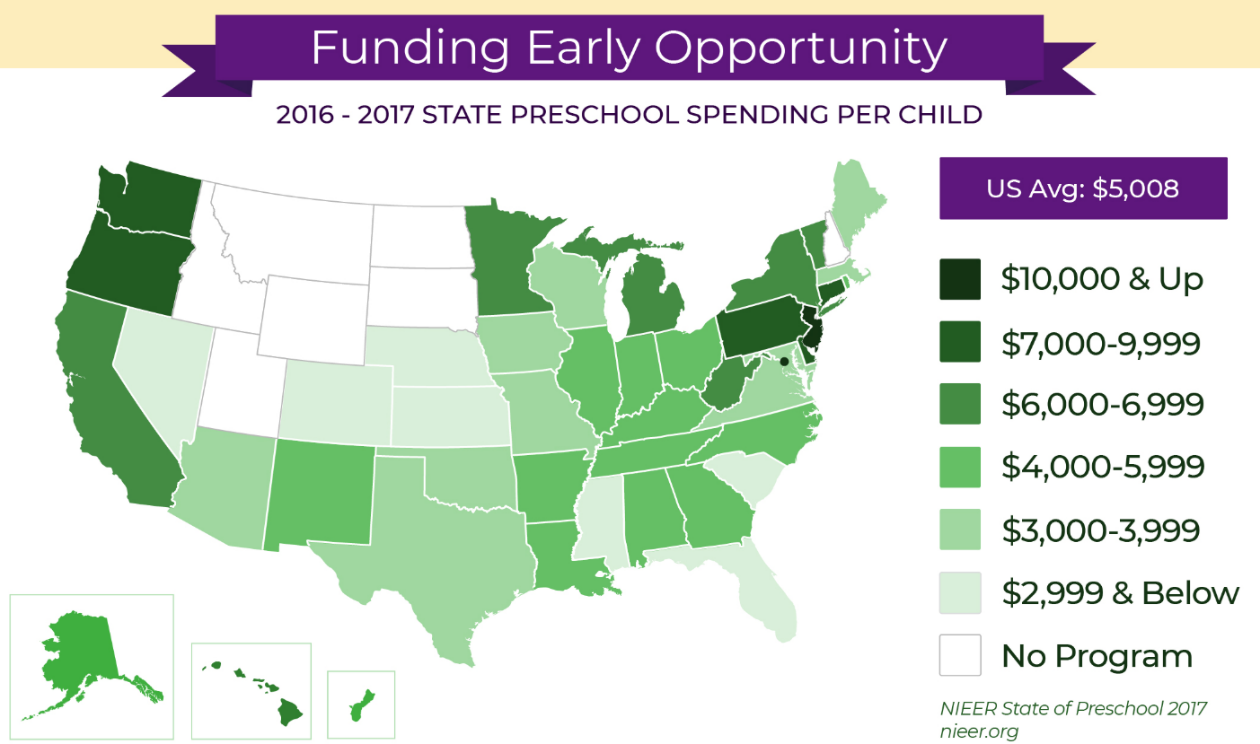
While speaking in terms of averages can help us understand nationwide trends in state funding, it is also important to understand that with the wide variety of funding mechanisms across the country comes a wide range in per-pupil state funding levels. In 2017, New Jersey spent more than $12,000 per child while seven states spent less than $3,000 per child (Source). See the National Institute of Early Education Research (“NIEER”) graphic below:
LOCAL FUNDING anecdotes: US cities and counties have taken access and funding matters into their own hands.
In certain states, legislation and statutes may grant cities and counties the autonomy to put local property or sales tax referendums on their ballots to create new funding streams for early childhood education. In Florida, seven counties have taken advantage of the state law that allows voters to establish new, dedicated funding sources for children. In one example, voters elected to fund The Children’s Trust of Miami-Dade County, which provides about $100 million annually in a variety of services for children, including public pre-schools (Source).
Per, ECS’s “How States Fund Pre-K”, cities can (and some do) set aside dedicated funding streams for programming. “For example, Denver and San Antonio have expanded access to pre-K through sales tax revenues. Seattle does so through a property tax, while Philadelphia uses a tax on sodas” (Source). An increasing number of local governments are also considering investing in Universal Pre-K programs. In 2014, New York City used local funding to increase Pre-K services and more than tripled the number of 4-year-olds enrolled within two years (Source). In Chicago, Mayor Rahm Emanuel announced plans to roll out universal full-day Pre-K for 4-year-olds, using funding from (Source).
There is still work to be done.
As we’ve noted, total investment and total students served by preschool programs are trending up and are at record numbers, but it is important to also understand that there is still a large need to be addressed. We know that less than half of 4-year-olds and less than one fifth of 3-year-olds were served across all public pre-K programs in the US. Speaking to child care options more broadly, more than half the young children in the US (as studied in 22 states) live in areas with few or no options for care, as pointed out in a study by the Center for American Progress. This organization notes that 42% of children under the age of 5 live in a “childcare desert”, which is defined as “a zip code with at least 30 children under the age of 5 and either no childcare centers or so few centers that there are more than three times as many children as there are spaces in the centers” (Source).
We also know that a lot of early childcare education is funded through tuition payments from families, as public funding alone does not cover the cost of care provided across the country. A 2018 report from the National Academies of Sciences, Engineering, and Medicine (summarized here) points out that, “families pay approximately 52 percent of the total cost of early care and education, with the public sector contributing 46 percent and non-parental private sector funding covering about 2 percent.” This report also claims that in order to provide care that will support high standards, a highly qualified workforce, and equitable access for all families, an estimated $140 billion will be needed annually: “Transforming the accessibility, affordability, and quality of ECE provided outside the child’s home will require phased implementation, amounting to at least an estimated $140 billion annually from the public and private (philanthropy, employers, and families) sectors in the final phase of implementation.”
While we at Afton typically describe our work as being focused on “K-12” education, we can now include Pre-K education, as we’ve been working in Texas and Illinois to support different early childhood initiatives.
We understand the importance of Pre-K program quality and access and its potential for improving student outcomes in communities at large. Given the level of initiative and funding around the country and the size of the need to still be addressed, we feel there is an opportunity to ensure organizations are using sound financial strategies, policies, and practices to establish and sustain effective Pre-K initiatives. We are looking forward to continued work in early childhood education. We also hope to explore some of the unanswered questions that this post may have brought up, such as: access to quality programming, funding adequacy and equity, accountability, and effective governance systems.
——–
Footnotes:
- Public programs enrollment includes preschool general and special education enrollment, and federal and state-funded Head Start programs
- States providing Universal Pre-K programs in 2017: Vermont, Washington D.C, and Florida
- States providing a “form” of Universal Pre-K: Georgia, Illinois, Iowa, New York, Rhode Island, West Virginia, Wisconsin
- States not using state funding for Pre-K education in 2017: Idaho, Montana, New Hampshire, South Dakota, North Dakota and Wyoming