Author: Afton Group

Preparing for Your CCDF State Plan: An Introduction

CCDF State Plans are coming! In just over a year (summer ‘27), each state will need to lay out its plans for the next phase of its child care subsidy program, funded by the federal Child Care Development Fund (CCDF).

CCDF State Plans must be submitted every three years, although states can also make updates and changes in between deadlines. The state plan is an opportunity for state leadership to reflect on their child care subsidy program’s direction and lay out their priorities for the coming cycle. For advocates, it is an opportunity to push the state to demonstrate progress on shared goals.

This series is designed to support states preparing their CCDF State Plans, with a focus on payment rates and cost analysis.

Before we get into the nuances of this series, we need to cover some basics. If you work in ECE policy daily, some of this will feel familiar, but we think it’s worth taking time to lay out some definitions to get us all on the same page.

How childcare subsidies work

CCDF is the largest federal funding source that helps low-income working families pay for child care. It is a needs-based program for families meeting income and work/activity eligibility requirements. In the early childhood ecosystem, it exists alongside other funding sources such as private tuition, employer-sponsored benefits, philanthropy, Head Start, and state pre-K. The federal government sends money to states, and states distribute most of it as subsidies that families can use at a provider of their choice. States also use some funds for quality improvement and Child Care Resource and Referral agencies.

Every three years, states submit a plan to the federal government describing how their program works. That plan covers three areas:

  1. Eligibility and Access (e.g. who qualifies, copayment structures),
  2. Health, Safety, and Quality standards (e.g. licensing, provider qualifications, quality investments), and
  3. Payment Rates and Cost Analysis (e.g. how the state determines what it pays providers).

This series helps state-level decision makers answer key questions on the third area: how states set payment rates and the methodology behind those decisions.

How Rates Have Traditionally Been Set

For decades, subsidy rates have been tied to the Market Rate Survey. States survey child care providers on what they charge families in private tuition. For instance, if a suburban Denver center charges private-pay families $1,600 per month for infant care, that number goes into the survey. Aggregate thousands of those data points statewide and you get a picture of the market. The federal benchmark has been to set subsidy rates at the 75th percentile, meaning a family with a subsidy could theoretically access 75% of providers in their area. Most states have never hit that benchmark, but that’s the target.

The problem is well documented at this point. Providers don’t set their prices based on what care costs to deliver. They set prices based on what parents in their community can afford to pay. In lower-income areas, tuition is lower not because care is cheaper to provide, but because families have less money. Staff in those programs earn less, margins are thinner, and the mortgage still needs to get paid.

The Market Rate Survey measures price. Price does not equal cost. Setting subsidy rates based on price bakes in the inequity.

The Historical Path to Cost + The Newest Guidance

In 2014, Congress recognized this gap and amended the Child Care and Development Block Grant Act to allow states to set rates using an “alternative methodology, such as a cost estimation model” instead of the Market Rate Survey. The idea is straightforward: figure out what it actually costs to run a quality childcare program and staff it appropriately, then set rates from that number. There are now 12 jurisdictions that have adopted federally approved cost estimation models.

The most recent HHS guidance in January 2025 laid out explicit evaluation criteria that spell out what the federal government looks for when reviewing a cost-based methodology. This gives states a clearer path to understand what is expected if they choose to pursue the alternative methodology path.

Why This Plan Cycle is Different

Two things have converged to make the 2027 CCDF State Plan cycle more consequential than usual.

First, the economics. The last time states wrote their CCDF plans, $52.5 billion in federal pandemic relief was still flowing into child care. That money is now gone. Since then, provider liability insurance costs have risen 30-50% in some markets, and the childcare workforce still earns a median wage of just $15.41 per hour. Any cost analysis built on pre-2024 data is working from assumptions that no longer hold.

Second, the federal on-ramp. The January 2025 guidance removed real barriers to cost-based rate-setting. States that were uncertain about the process or skeptical of the administrative burden now have clearer answers than at any previous point.

The combination means states have both more reason and more opportunity to take cost-based rate-setting seriously this cycle. Whether that means pursuing a full alternative methodology or simply doing a more rigorous narrow cost analysis depends on where your state is starting from. This series will cover the different possible approaches and their pros and cons.

What this series will cover

Each post focuses on one question and closes with questions you can bring into your next meeting.

  1. Should my state pursue alternative methodology, or can we get where we need to go on the standard path? We’ll break down when the administrative lift is worth it, when it isn’t, and how to frame the decision for your team.
  2. How much field engagement does our approach require, and how do we go from field input to costs and rates? We’ll cover what meaningful provider engagement looks like and a three-step process for going from family needs to cost estimates.
  3. How outdated is our last cost analysis, and what specifically needs to be updated? We’ll walk through the cost drivers that have shifted most since 2024 and help you assess what’s still usable and what isn’t.
  4. Are there populations our cost model doesn’t account for that it should? We’ll look at children with disabilities in community-based settings, dual language learners, and children needing overnight, weekend, or extended hours care, and what it would take to build in the true costs of serving them.

Each post stands on its own. Together, they map what thoughtful preparation looks like over the next year, so that your state can enter the next three years with a meaningful and intentional approach.

Reimagining the School Funding Adequacy Study

In 2023, the Washington D.C. Office of the Deputy Mayor of Education (DME) sought to re-examine how schools in D.C. are funded and how the existing funding structures serve students.

Over the past several years, D.C. has made great strides toward adequate and equitable funding, striving to ensure that students have the resources they need to succeed. Even so, persistent opportunity gaps exposed a need for further exploration, especially given that different funding levels targeted to needs did not easily explain those gaps. Why aren’t the investment levels lining up with outcomes?

In light of COVID-19 and other pressing external factors, it became clear that supporting students and families through a global pandemic and intergenerational poverty will take all of us. Schools have been asked to meet increasingly comprehensive needs, without the formal charge or funding structures to support that charge. What is the role of the school, and how can education and community leaders come together to provide the services and resources needed for brighter futures in their respective areas of influence? It was in this spirit of enduring commitment to continuous inquiry and improvement that led us to co-create an innovative approach to guide school leaders’ next steps.

Complex circumstances require a context-sensitive approach

Like many states, DC completes a periodic, legislatively required ‘funding adequacy study’ to determine the resources needed for students to meet standards. Adequacy studies go back to the 1990s as part of the standards-based movement, and the approaches remain in use today. While this history is an important foundation for school funding policies, The Deputy Mayor for Education (DME) saw the 2023 legislative requirement as an opportunity to think differently and partnered with Afton to collaboratively meet the moment. Given the complexity at hand, we knew we needed to examine the problem from multiple angles. We also knew we needed to engage the expertise of those most affected by—and yet also typically excluded from—policymaking decisions: students, families, and school communities.

The desire for a data-informed understanding of current resource use and future resource needs led us to embark on a deep data exploration journey. As part of this journey, we developed archetypes of students and schools that helped us understand current funding and spending relative to student and community needs and outcomes at a far more nuanced level than is typical. This also positioned us to ensure adequate stakeholder representation across all archetypes developed, creating a ‘diverse by design’ approach to gathering input and feedback.

As a team, our desire to more fully understand the local context laid the foundation for a pioneering triangulation method that linked:

  • national expertise, economic modeling, and quasi-experimental research findings;
  • broad local stakeholder engagement from school leaders and staff, parents and caregivers, students, and community agencies; and
  • deep data analysis on student demographics, needs, outcomes, and LEA- and school-level spending data.

This triangulation approach offered significant improvements to traditional adequacy study methods alone. While traditional methods– including the national Evidence-Based (EB) and Professional Judgement (PJ) panels– rightly form the foundation of this work, the triangulation of additional methodologies provides a richer understanding of needs and opportunities. Combining existing methods with deep student- and school-level data analysis and abundant stakeholder engagement allowed us to meaningfully incorporate the insights and wisdom of the students and families experiencing the system every day. While typical adequacy studies offer insight into how much should be spent, this study had a keen eye on how resources can be more effectively allocated. We could better understand student and resource needs at a more granular level than typical need categories, and then take several steps further to determine the appropriate level of local investment that would support those needs.

The substantial stakeholder engagement also provided a better basis for contextual recommendations. We were able to identify levers that can support LEAs and schools and ensure that dollars are spent efficiently and in a way that serves students most effectively.

A research approach that honors nuance, highlighting tensions and common ground

Triangulating the three methods brings out agreements and tensions in the data sets that otherwise may not surface. Where agreements exist, we can see elements of the problem in high contrast and know that it’s a clear pain point. Multiple lenses also can help clarify cause(s) and identify viable solutions. Where tensions exist, we’re better able to design solutions thoughtfully, with higher regard for the possible unintended consequences or trade-offs that we wouldn’t have known to be mindful of otherwise.

Stakeholder voice through school leader interviews and parent surveys helped us understand that schools were being asked to do more than they ever have and, in many cases, without the formal charge or necessary resources to meet those increased demands. Thanks to our triangulation method, we could immediately see that local data backed up that insight.

For instance: on average, schools spend less than 50% of their resources on instruction. Notably, schools with the highest needs often spent the least funding on instruction, as their student population required more non-instructional supports.

Our data also showed that resources spent on mental health support were high, relative to other spending. Even so, school leaders told us they would use extra dollars for additional mental health support and staffing, suggesting that their base resources did not adequately meet needs. Administrators also noted the increased demands of the teaching profession, expressing the desire to find ways to mitigate increasing burnout and turnover.

Perhaps unsurprisingly, we heard from parents and families – across all wards and races – that they prioritize a positive academic reputation, highly qualified teachers, and a positive school culture. While we know from research these factors all directly impact student achievement, hearing directly from parents and families that they wanted to prioritize supportive measures to those ends created alignment. Leaders can now move towards pursuing well-informed additional investment and they strengthened the school-community connection having sought their valuable input on where the unmet needs exist.

A human-centered study facilitates better decision-making and promising outcomes

Our triangulation approach to the analysis provided a rich and diverse evidence base that informed a set of options and opportunities. Leaders are now equipped to make decisions for change that encompass immediately actionable shifts to funding levels within the funding formula, while also taking on related policy considerations to support change within and beyond the District.

In fact, change has already happened. Along with a 12.5% increase to the foundation level for teacher compensation, the weights within the funding formula are changing, too:

  • The at-risk weight will increase from 0.24 to 0.300
  • The alternative weight will increase from 1.52 to 1.58
  • The adult weight will increase from 0.91 to 1.00

Beyond the funding formula, specific recommendations also surfaced for additional funding outside the funding formula. These recommendations included support for mental health services, teacher pipeline development, and pilot programs for a neighborhood-based approach to school transformation. We also recommended specific avenues for pursuing improved system efficiencies, as well as enhanced financial reporting and transparency to keep a keen eye on spending patterns as they relate to outcomes.

In addition to the published report of the full study, the work informed an interactive website customized to various users to support broad engagement with study approaches, findings, and recommendations in a human-centered way.

At Afton, we put people first. Doing so results in stronger research design, more nuanced insights, and better decision-making. We are proud to come alongside communities to co-create both problem-solving processes and actionable solutions in a way that respects and engages those who stand to be most impacted. Ready to get started on yours? Get in touch.

Using Your Charter School Finance Committee for Impact and Sustainability

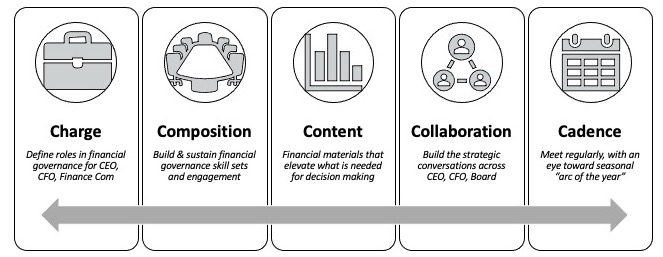
At Afton Partners, we advise our charter school partners to follow the framework of the “5 Cs” when developing and evolving their organization’s financial governance. The “5 Cs”– Charge, Composition, Content, Collaboration, and Cadence– provide a roadmap for cultivating strategic thinking and effective decision-making with your board, all meant to elevate and sustain what’s working in your schools.

The 5 Cs of Charter School Financial Governance

The 5 Cs of school financial governance are arranged in a line.

Charge: Who is responsible for the financial decision-making process for charter schools?

To ensure a seamless sharing of responsibility, it’s an important first step to define everyone’s roles clearly. For instance, the leadership team is primarily responsible for the daily leadership and execution of the priorities set in collaboration with the Board. The Board provides oversight and accountability and ensures fidelity to the plan, including the financial plan. Blurred lines can lead to the co-managing of the budget–not an optimally effective or desirable approach. On the other hand, administrators should feel supported and not solely responsible for the organization’s financial strategy and health. Everyone has an equally important and distinct role in the stewardship of the school’s financial resources.

Setting shared expectations– with an understanding that roles will grow and evolve as the school network grows– builds trust and lessens confusion around how decisions are made and who will execute which pieces.

For example, when it comes to financial decision-making, the school board finance committee serves as a consultant, ambassador, and governing body. The CFO has the important role of collaborator, content creator, and guide to strategic decision-making. And, contrary to what some may believe, the CEO has an important role in ensuring a strong board composition, board engagement and collaboration, and guide in strategic decision-making alongside the finance committee.

Composition: Who should be on a charter school finance committee?

A charter school board finance committee carries out the principal aspects of the board’s financial duties. They set fiscal policies and expectations, continually assess the financial health and direction of the school or network, and make strategic financial decisions in alignment with the broader strategic plan.

To carry out these duties, a strong board finance committee should consist of diverse professional backgrounds and skills, including business strategy and operations; banking; fiscal planning, management, and analysis; and real estate. Board members leverage their expertise and connections in their respective areas to strengthen and sustain the school or network’s financial standing.

In our practice, we find that taking care to build and sustain your board’s financial skillsets and engagement translates to high impact.

Content: What information is important for effective financial governance?

The Finance Committee should have the materials and data needed to make decisions that support long-term sustainability and align the budget to the overall priorities. Examples include:

  • Year-to-date financial statements, compared to budget
  • Long-term financial projections
  • Cash flow monitoring
  • Current key performance indicators and up-to-date financial reporting on those metrics
  • Metrics on debt compliance and authorizer standards

With this information, the committee can then develop or revise standard metrics criteria across key performance areas (e.g., cash, enrollment, fundraising, net assets, etc.) and decide on targets. Part of each meeting should be devoted to evaluating progress towards the targets.

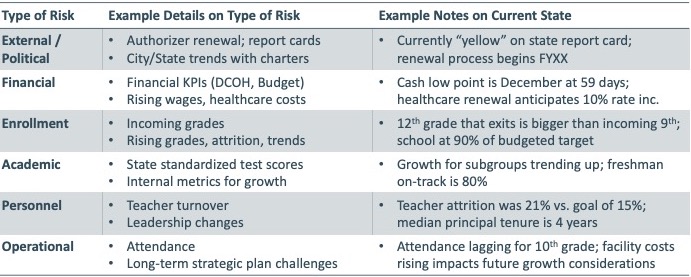
To mitigate challenges toward those goals, the committee should also monitor the organizational risks related to financial planning and decision-making.

The table details types of risks charter school finance committees encounter and examples of those risks.
Example categories that can be adapted to suit your school context, as each will affect financial position and forecast.

Collaboration: How should finance committee members work together?

First and foremost, the ability to collaborate well requires everyone to understand their roles regarding the organization’s financial management. Leveraging their various skill sets, committee members work together to build ongoing conversations with one another, the CEO, the CFO, and the full board. Engaging each member’s background and insights facilitates healthy discussion, leading to actionable strategic plans and informed decision-making. Effective finance committees should also commit to making adequate time for the work at hand, earning one another’s trust, and coming prepared to fully engage.

For best results, CFOs and Finance Committee Chairs should plan to work together one-on-one in advance of committee meetings. This ensures that the right priorities and information are presented to the group for productive discussion and strategic decision-making. Working in close consultation with the CEO, this trio provides leadership for the larger board to consider academic investments with respect to financial guardrails. Especially amid complexity during the budget cycle, their collaboration with one another and the meaningful incorporation of their respective vantage points is critical to impact and sustainability.

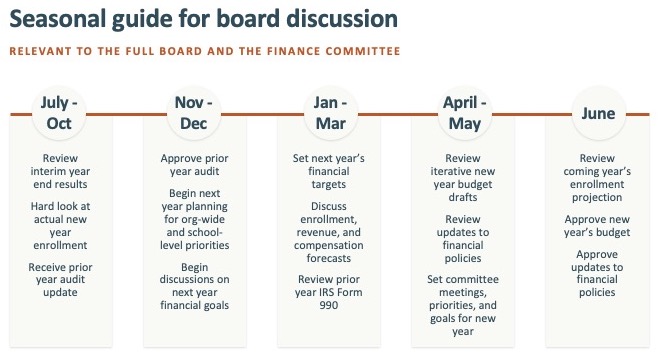
Cadence: What is an effective meeting plan for a finance committee?

Finance committees should meet regularly, with an eye toward the seasonal “arc of the year”.

A sequenced meeting calendar notifies the board of decision-making timelines. It also mitigates the risk of smaller–but no less important–agenda items getting crowded out by a waterfall of more discussion-heavy priorities.

Prescheduling board meetings for the year can aid in the planning process for each meeting and provide predictability for committee members. Prescheduling also allows the committee to allocate the proper amount of time to items requiring a deep dive, ensuring that multiple major discussions or approvals do not end up on the same agenda.

Putting Effective Financial Governance in Action

Intentional financial governance increases impact and improves sustainability. If you don’t have an engaged, effective finance committee, it’s not too late to make it happen. Use the 5 Cs to help you determine where to invest your time. Want more hands-on support? Reach out to our team!

As the national leader in charter school financial planning services, we understand the unique challenges charter management organizations commonly face. We have partnered with more than 80 networks of all sizes, from single-site operators just getting started to the largest charter school organizations in the country. Our services for charter schools build finance capacity, strengthen financial sustainability inform school resource allocation, and strategically inform organizational decision-making on growth, facility affordability, debt financings, mergers, and restructurings. To learn more, contact Carrie Stewart.

*Check out this article.

Eight Community Engagement Practices That Facilitate Stronger Decision-Making

Answers exist in the communities being served and it is our job to support our public sector partners in uplifting them. The issues we take on do not have “one-size-fits-all” fixes; context matters to both defining the problem and crafting the solution. As such, local champions who know the landscape and can commit to carrying out a vision play a critical role in shaping success. They are also well-positioned to improve newly implemented programs and policies over time to ensure intended and sustained impact. 

To tap into the wisdom of the community, engagement must be pursued with intention. We recommend eight key practices to create meaningful opportunities that result in rich and actionable insights.  

PRACTICE #1: Come into engagement activities curious, without assumptions or predetermined ideas. 

As facilitators of the Governor’s Workforce Commission on Equity and Access in Illinois, we started by exploring the needs of the workforce development system users to understand their challenges and pain points. With our colleagues at MDRC, we created job seeker personas and journey maps and conducted many focus groups with workforce providers and job seekers. Notably, we uncovered specific issues for undocumented workers who felt they could not access good jobs because of work authorization requirements. We also learned that they feel their education, skills, and work experience gained in their home countries are not appreciated or valued in the U.S. They wanted more guidance in using those skills beyond the employment market that overlooked them.  With that input in mind, the resulting recommendations included expanded support for those interested in entrepreneurship and self-employment. 

PRACTICE #2: Include the most impacted individuals, with particular focus on historically underrepresented groups. 

Illinois’ transition to a new unified Department of Early Childhood prompted the creation of robust new engagement channels to include input from impacted parties in the agency design process. While they were successful in hearing from nearly 1,400 individuals, only a small percentage of them were parents or providers. With the help of Afton Partners, the state doubled down on their efforts to reach those groups. We implemented a regional listening session plan, inviting local organizations across the state to serve as hosts. Leveraging local networks proved successful: the 1,700 new participants represented every county in the state, and 98% identified themselves as parents or providers. Of those who were parents, 40% identified as Hispanic or Latino, and 25% identified as African American. Over half of the participants represented rural communities. The more robust participation ensured we had insights that better reflected different communities’ experiences with the current system and what improvements they would deem helpful. 

PRACTICE #3: Make engagement accessible for participants. 

With the Colorado Early Childhood Compensation and Benefits Task Force, we conducted focus groups and surveys in English and Spanish. Additionally, we offered meeting times in both the afternoon and evening to accommodate participants’ work schedules.  Participants received incentives and professional development credit for their contributions and time. To ensure an inclusive process, communications came in multiple formats and included sign language, ADA-compliant accessibility in print and online materials, and the avoidance of jargon in favor of language everyone could relate to. All of these measures led to robust input, and the insights played a valuable role in the development of the task force’s recommendations.  

PRACTICE #4: Set norms and expectations from the start. 

Afton facilitated the development of the Great Start for All Minnesota Task Force’s guiding principles that set the conditions for their process and final recommendations. Co-developed by members, the principles reflected the task force’s values and provided shared expectations for engagement.  

Revisiting the guiding principles at every meeting kept everyone aligned in productive conversation that valued input from all members.  The 12 norms and expectations included: 

  • Attend meetings prepared and on time 
  • Engage in respectful dialogue 
  • Everyone’s input is important 
  • Assume best intent 
  • Listen with an open mind, and for commonalities 
  • Don’t say or type anything you wouldn’t want to have shared in public 
  • Don’t just disagree, offer a doable alternative idea 

In complex processes, co-created norms and expectations offer built-in accountability that has full buy-in from the start. The result is less conflict, quicker course correction when needed, and more efficient discussion in pursuit of the end goal.  

PRACTICE #5: Demonstrate respect, transparency, honesty, and genuine appreciation for all perspectives shared. 

In any community engagement activity, people want their input to be heard, valued, and impactful. In our focus groups conducted with the Colorado Department of Early Childhood, we made sure to clearly articulate why input is needed, what it will be used for, who it will be shared with, and how it will influence final recommendations. We made it clear that there is “no wrong answer” and guaranteed anonymity in our notetaking to encourage sharing and disclosure. Finally, to ensure we close the feedback loop with participants, we shared the final report with our summary findings and results so they can know how their perspectives shaped outcomes and their efforts made a difference. 

PRACTICE #6: Pursue broad and diverse participation when analyzing and making meaning of data. 

Individual, structural, and institutional biases can emerge in community engagement work, and it’s also important to consider statistical bias. In our data analysis and financial modeling work for school districts and charter school networks, Afton emphasizes the significance of looking at site-level financial, academic, and student data in school-level funding allocation policy and budgeting. This must accompany district-wide data analysis to make sure important details aren’t missed.  

For example, certain schools may have higher or changing needs of students, or student outcomes may be on an undesirable trajectory. Examining funding variation across all sites with distinct characteristics and forecasting future expenditures and investments at the school level can reveal unintentional inequities in the school plan. Therefore, it’s critical to have broad participation from education staff, community members, and students and families in interpretive activities that inform decisions.  Those with lived experiences related to the data can explain what it means to them, providing enriched understanding and problem-solving possibilities. 

PRACTICE #7: Conduct iterative engagement activities at various points in the project; consider a variety of methods or approaches. 

Our work with the Office of the Deputy Mayor of Education in Washington DC sought to develop a funding policy that provides equitable and adequate resources to serve each student well and to make a clear case for policy change. In collaboration with our project partners, we identified four primary groups to engage with through a variety of methods: district leaders; school personnel; families, students, and the community; and city leadership. The strategies to engage with each of these groups varied to meet the needs and positioning of participants. For example, we used a survey to capture straightforward financial data from district leaders who deal with the funding policy daily. However, a focus group proved more appropriate for parents and families, allowing for nuanced conversation about the resource needs of students. Finally, we interviewed key school personnel and leaders to gather their insights on the implications of the work at hand.  

Taken together, some groups and methods provided foundational information while others provided valuable reactions to proposals as they took shape. We synthesized all of the feedback to discover recurring themes across the district that either fortified quantitative data or showed important areas of tension, all of which informed the final policy recommendations. 

PRACTICE #8: Ask for feedback along the way and at the end. 

How do you know your process works for participants? Do they feel they have adequate opportunity to share? Do they walk away from each encounter feeling informed? Empowered? Something else? What could be improved for the next community engagement activity?  

In addition to gathering responses to make short-term adjustments, collecting feedback at the end of an initiative offers teams an opportunity to reflect on both the outcomes of a process and the methods used to create them. For instance, every phase of a project brings about a new host of questions. And yet, survey fatigue is real. Narrowing in on the most important questions and choosing the appropriate approach (“is a survey the right way to get what we need?”) can facilitate high-quality responses and reduce attrition over time.  

Done well, community engagement offers unparalleled insight into the reality of complex problems and their workable solutions.  

But we can’t just go through the motions.  

Employing the eight practices will ensure you harness the power of collective wisdom to create the transformational change your communities want and deserve.  

IL Gov. Pritzker Touts Early Childhood Focus in 2024 State of the State Address

Earlier today, Illinois Governor Pritzker delivered his State of the State Address, highlighting Smart Start Illinois, which is a historic investment in the state’s early care and education (ECE) system. Smart Start launched last year and is already improving access to quality child care and other critical services for young children and their families, while providing long overdue support for professionals working in the system.

This year, Governor Pritzker is seeking the legislature’s support for a $150 million increase for the second year of the initiative, bringing the total investment to $400 million. Key investments include:

  • $200 million for Smart Start workforce initiatives, including Smart Start Workforce Grants, to help child care providers meet a new, higher wage floor for their staff and stabilize the field.
  • $75 million increase in the Early Childhood Block Grant to increase quality and create new slots in preschool deserts.
  • $13 million to begin the state’s transition to a unified early childhood agency – the Department of Early Childhood.

Afton has a front row seat to Illinois’ efforts, working closely with state leaders to thoughtfully engage stakeholders in a way that centers equity and the human experience while also bringing our expertise in data analysis and cost-modeling for accurate and strategic allocation of resources. We are proud to support the design of the Smart Start Workforce Grants, ECBG allocation, Early Intervention payment reform, and the transition to a unified early childhood agency.

Smart Start Workforce Grants

Nationwide, ECE staff are drastically under-compensated for the important work they do, with an average wage of about $13/hour. Low compensation means child care programs struggle to recruit and retain qualified staff and families cannot find child care for their children. IL is one of a small number of states that has committed significant resources to address this issue. If approved by the legislature, funding for the Smart Start Workforce Grants (SSWG) would build on the previous investments.

Workforce Grants are an innovative approach to address the ECE workforce shortage, using the state’s general revenue to supplement ECE teacher salaries. Child care programs that participate in SSWG will receive funding to pay their classroom staff at least a base wage (the “wage floor”). In other words, these programs will be able to meet a higher wage floor for their staff without raising tuition for their families.

Afton’s Role

Afton supports the planning and design of the SSWG through facilitation of robust stakeholder engagement efforts that include ongoing advisory committee engagement, provider focus groups and surveys. We create opportunities for the state to meaningfully engage the providers who may benefit from these grants and ensure that the unique perspectives of Spanish-speaking providers, home-based providers, and others who have had less access to grant opportunities are considered in design and implementation.

Afton also led the development of IL’s child care cost model, a tool that helped determine the cost to meet the wage floor across different program types and regions to ensure that grant amounts are sufficient to cover the costs of raising wages. This critical support helped determine the parameters of the program so that SSWG can reach as many child care programs as possible within the budget.

Early Intervention

Early Intervention (EI) provides crucial support for young children experiencing or at risk of developmental delays. Unfortunately, payment rates have not kept up with inflation in recent years, straining the system and negatively impacting recruitment and retention among the EI workforce, which includes service coordinators, interpreters, and therapists (such as developmental, speech, occupational, and physical therapists).

Afton’s Role

Afton is supporting an innovative project to develop a cost model for Illinois’ EI system and consider options for payment reform. To date, hundreds of EI practitioners and families have participated in focus groups and surveys that Afton facilitated to give their input on changes they hope to see in the system. Using this input, Afton will work with the Bureau of Early Intervention to develop a cost model that reflects the true cost of providing EI services across the state. Afton is also supporting state leaders in considering short- and long-term improvements to its approach to payment to improve access to high-quality EI services for children and families.

Early Childhood Block Grant

As a critical component in this system, the Early Childhood Block Grant (ECBG) provides funding for early childhood and family education programs and services that help young children enter school ready to learn.  The Illinois investments are intended to increase access to programs, with a focus on preschool “deserts” – regions that lack access to ECE programming – and support quality improvement across new and existing programs.

Afton’s Role

To address inequitable access to high quality programs, Afton has partnered with ISBE to identify and prioritize preschool deserts for new ECBG allocations. Afton is also supporting ISBE to develop a “cost model” that informs equitable funding allocation decisions. Afton will leverage quantitative data and engage stakeholders to inform the cost model.

IL Governance Transition

So often, early childhood systems and structures are designed around funding streams, resulting in a patchworked system that places the burden on families to navigate a dizzying maze of programs and services. Last fall, at the recommendation of the Afton-facilitated IL Commission on Equitable Early Childhood Education and Care Funding, Gov. Pritzker initiated the transition to a new, unified Department of Early Childhood. The transition will provide the state with a unique opportunity to thoughtfully redesign and rebuild an equitable, accessible, family-centered early childhood system. The effort will require reorganization of programs and funding streams that currently span three separate agencies under the new umbrella.

Afton’s Role

Over the next three years, Afton will collaborate with several state agencies, state and local advisory bodies, and communities – particularly those that have been historically underresourced and underserved – to inform the design of the new unified state agency with a racial equity, family-centered lens. Given the complex funding streams involved, Afton will also leverage our deep funding design expertise to identify equitable funding strategies that support the redesigned system.

Impact

In IL and across the country, Afton is excited to collaborate with those who are most impacted by challenges in the early childhood system to create solutions that will work with appropriately allocated resources. Illinois’ work has tremendous potential to serve as a model for other states. We invite you to stay tuned as these initiatives advance and we analyze the impact of these innovations. We will continue to share our learning and resources that other states may find useful as they explore policy change and investments that support the best outcomes for children and families.

Fiscal Cliff Pressures – the Impact of ‘the Six Es’ on District Budgets

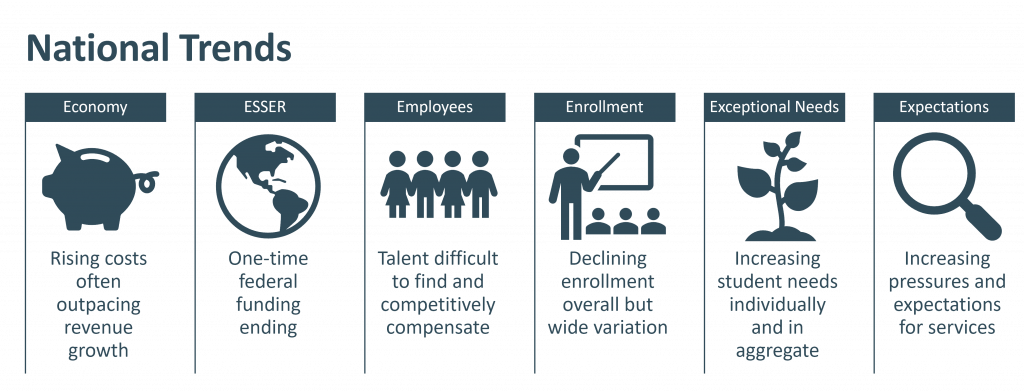
At Afton, we’ve referred to these interrelated challenges in a framework called ‘the Six Es’:

  1. Economy: States, localities, and districts are facing overall rising costs, and those costs are frequently outpacing revenue growth.
  2. ESSER: Many states and districts used one-time pandemic relief funds to cover recurring, increasing costs, but these funds are slated to end this year while the costs remain.
  3. Employees: Educator talent is more difficult than ever to find and competitively compensate, which can be especially challenging for roles and locations that have seen long-standing shortages.
  4. Enrollment: States and districts are experiencing uneven enrollment changes, complicating district revenue in the short-term, and enrollment is likely to continue to decline overall in the long-term.
  5. Exceptional Needs: Although overall enrollment trends are down, the share of students with greater special education needs, language learner needs, mental health needs, and learning loss needs is rising.
  6. Expectations: Increased needs have led to changing community expectations of the role of schools, and a desire for a higher level of baseline services at all schools.

States and districts will need to rely on one another to address these challenges:

  • States need strong districts to provide the best possible experience for all their students.
  • Districts need states to support their work by providing clear expectations and equitable, adequate, and sustainable funding and systemic solutions.

As both plan for the near- and long-term, neither can do it without the other. Understanding your unique state and district “6E context” is foundational to creating strong policies and programs as we move forward in 2024.

Interested in discussing the 6 Es in your context? Please contact Afton Senior Directors Heather Wendell and Kevin Wenzel to learn more about the work we do. We look forward to being in touch!

2023 Year in Review and Looking Ahead

Every initiative we have supported has offered an opportunity to strengthen social systems with a focus on justice. We’ve expanded our skill sets to offer a comprehensive set of solutions to drive change in the public sector, including:

  • Community and family engagement
  • Financial planning, budgeting, and cost modeling
  • Funding policy design and implementation
  • Research and analysis
  • Strategic planning and implementation

Whether in early care and education, K-12 systems, workforce and economic development, or higher education, we put people first and drive changes that create a future where we all can thrive. Here are some highlights from 2023 that helped us learn and grow into who we are today: a team of committed collaborators prepared to walk beside you and take on the complex issues facing us in 2024 and beyond.

2023 Highlights

Look at our amazing team! We added close to 20 full time staff members in the last year who bring decades of diverse experience and skillsets to make Afton even stronger than before!

We conducted over 70 different initiatives last year in 22 states, the District of Columbia, and Puerto Rico—some big, some small, all of which are in line with our core values. We would love to tell you about each one but will instead zoom in on a few headlines that stand out as special:

  • We guided Boston Public Schools’ Reimagine School Funding project and grew tremendously through equity-focused, inclusive community engagement that allowed for deep reflection on the evolving role of the school.
  • We partnered with the DC Deputy Mayor for Education to develop a new approach to district/school funding adequacy studies, in collaboration with Augenblick, Palaich and Associates and Metropolitan Strategies and Solutions. We are excited to share the final report in the coming weeks—connect with us on LinkedIn to be the first to know.
  • We continued our support for Illinois’ historic efforts in early childhood through design and development of proposed Smart Start Workforce Grants, cost modeling and data analysis for state-funded preschool, cost modeling and payment reform strategies for Early Intervention, and facilitation of a stakeholder advisory body for a new early childhood state agency.
  • We supported dozens of charter networks in 15 states, the District of Columbia, and Puerto Rico on growth planning, facility affordability analyses, financial sustainability, and strategic resource allocation.
  • We developed ‘the Six Es’ Framework to acknowledge the unique context that K-12 public schools, including charters, are operating within. We approach our work with careful consideration of each of these factors, which have potential to destabilize systems if we don’t get ahead of them.
  • We promoted fair early care and education staff compensation and benefits through two separate projects in Colorado.
  • We have begun measuring the impact our work has on the field and use that data to be more strategic, reflective, and effective in the future. If you get a survey from us, please know that we deeply appreciate your comments and insights!

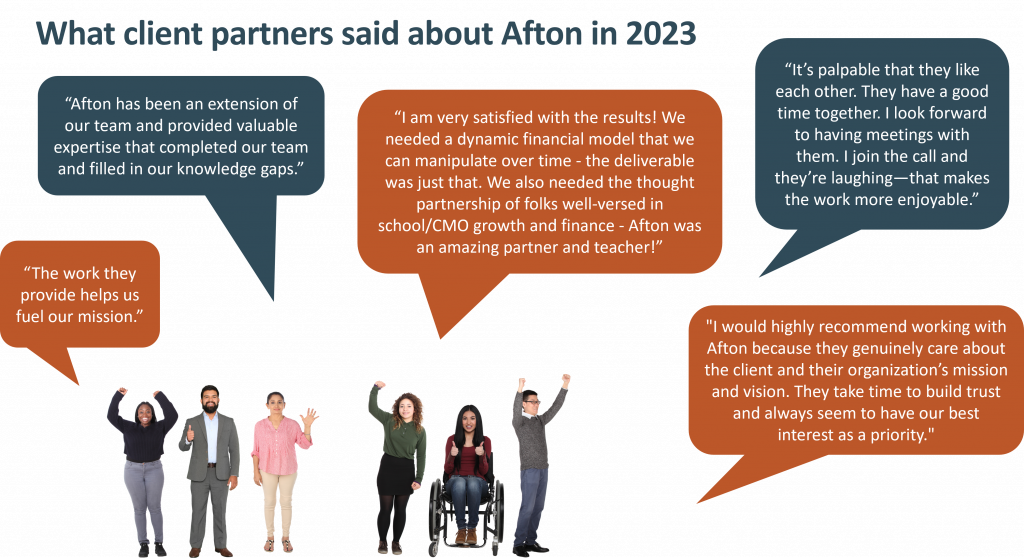
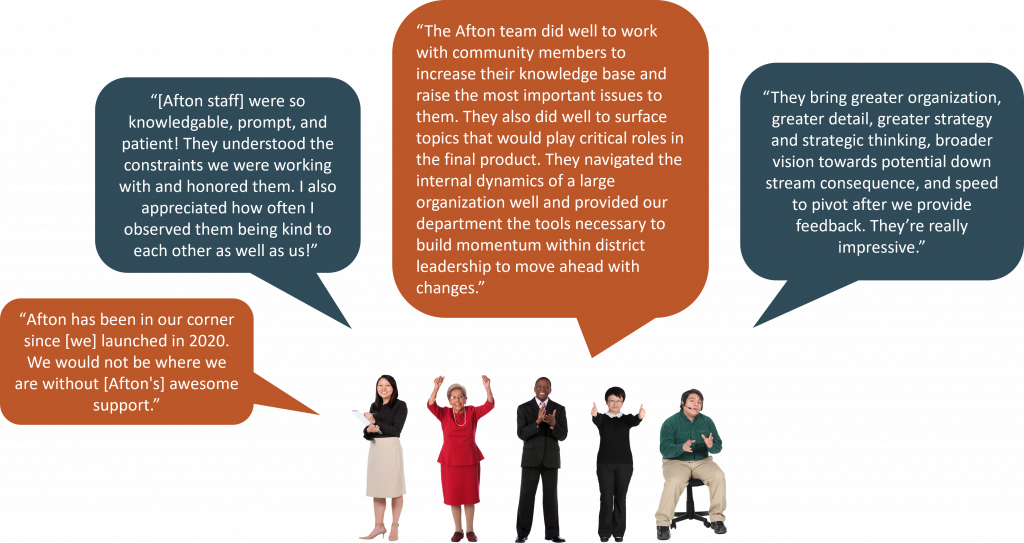
On that final note, we are so pleased when we hear that our service hits the mark, as some of you have graciously shared with us. Here are some quotes shared by our inspirational partners in 2023.

From all of us at Afton, thanks for joining us on the journey! Even in the face of systemic shortcomings, social and racial barriers, and shrinking budgets, when we work together, we can create a future where we all thrive.

Financial Stewardship in a Time of Elevated Pressures

We believe effective financial stewardship consists of three major pillars:

  • Enacting your mission through resource allocation,
  • Protecting your money with controls and governance, and
  • Making good resource decisions that can be sustained and leveraged toward achieving your desired long-term impact.

Leaning into your strategic fiscal oversight and operations is in tune with the moment – many public schools face elevated pressures related to enrollment uncertainty, ESSER funding expiration, student needs, and talent, all of which have significant financial implications. Further, charter schools have disproportionately complex funding and financial reporting and overarching public policy circumstances. Getting rigorous with your financial stewardship can be an enabler to navigating those waters, fending off sustainability problems and threats to your mission.

So, let’s unpack some practical ways to be more rigorous in your financial oversight…

Reflect the Mission: To do this well requires a thoughtful perspective on your instructional and operational priorities. Each year, the budget should highlight specific investments that are intended to make progress toward the school’s goals and achievement of its mission while sustaining a strong foundation. Given that personnel is likely to be your biggest investment, are proposed annual adjustments in talent aligned to your priorities for the year and the long-term mission? Which schools and grade levels require particular intervention, and how is that reflected in the budget?

Protecting Money Through Controls and Governance: The board, CEO, and CFO are responsible for providing a high-quality education for your students AND ensuring good stewardship of public funds. This includes ensuring financial health and sustainability day-to-day and week-after-week, as well as preventing fraud and misfeasance. So first, we’ll give a reminder you probably don’t need: you must do everything you can to prevent a crisis. Governance, controls, reporting, and compliance build your organization’s foundation for success, and must be a recurring focus. Let’s dig into what that looks like…

First, clearly delineate which aspects of financial reporting are led by senior management and what role the board plays in overseeing the financials of the organization. The roles must evolve as your organization grows, matures, and becomes more complex. Regardless of the approach, your money and resources must be protected, so the finance department will require resources. Additionally, enacting engaged board financial governance is a critical fiscal control and an enabler of sound financial decision making. As a rule of thumb, you’ll want at least three engaged board members who are well versed in financial statements and fiscal planning. The finance committee, made up of staff and board members, should meet monthly or bi-monthly and cover a standing agenda of monthly reports on cash position, budget variance, enrollment, other dashboards, risk management, and seasonally appropriate topics.

Making impactful resource decisions: Can you identify what you need now and later to generate your desired impact? Use your student data to inform prioritization of investments at each of your schools. Balance your instructional priorities with some financial planning, checking your assumptions on operational matters like:

  • Expected growth rates in state per pupil funding and/or federal funding shifts.
  • Enrollment data by grade-level.
  • Wage increases and any changes in the cost of benefits.
  • Needs for technology, curricula, professional development, maintenance, transportation, food insurance, audit, and legal expenses.

There’s a reciprocal relationship between focusing on the present and future of your finances: your fiscal health today will determine what you’re capable of tomorrow, and today’s decisions must be based on what you hope to afford in the long-term.

As a general guideline, you should utilize at least 2-3 years of historical trends to build a 3-5 year model that reflects your cash position and conservatively forecasts costs that might arise. With all this in hand, you’ll be prepared to navigate your work of delivering high-quality education with strong fiscal stewardship.

Download Afton’s slide deck on Financial Stewardship

Summer Charter School Enrollment Scenario Budgeting Advice

Summer recruitment can bring up to a 20% surge in enrollment depending on local context and organizations’ time, resources, and focus. To achieve that surge, it’s critical to invest in marketing and recruiting activities and in particular, to tailor your strategies to your greatest areas of need. Summer recruitment activities require discipline in a variety of proven recruitment strategies including immediate lead follow-up, family engagement activities, old and cold lead follow-ups, efficient and engaging family onboarding, and family referral encouragements.

No matter how well we enact these strategies, there are often forces that will prevent us from meeting our enrollment goals. There are significant financial implications to missing enrollment targets. From a fiscal health standpoint, our schools will suffer unwanted consequences if we wait until close to the beginning of the school year to plan for operational changes required by enrollment misses.

While it isn’t fun to prepare for the downside possibilities, doing so protects your school(s) and the quality of your student services in the long run. We recommend you:

  1. Develop your downside fiscal scenario – how much of a fiscal deficit might you have from enrollment shortfalls?
  2. Confront the reality – The downside fiscal amount is a leadership and communication tool – it is a brutal fact that requires buy-in before rallying to fix it.
  3. Identify your stakeholders and rally the team – Be clear on who owns what responsibilities in the process of planning for downside mitigation strategies, knowing often the finance team might inform rather than make the decisions.
  4. Set a timeline for decisions – What is your cutoff date to determine how many students you anticipate and when implementation of changes should start?
  5. Monitor and leverage data – Report daily and weekly enrollment by grade and by school; use the data to inform where changes might need to be enacted. Use student outcome data to guide trade-off decisions.

With the team and timeline in place and your values at the center, your school organization can identify budget mitigation strategies equitably and effectively. At Afton, we believe the answers lie within your school communities. They depend on your student needs, your organizational values, and instructional strategies. And, there are some common approaches to consider as starting points. Learn more about these approaches in our Enrollment Scenario Budget and Planning document.

Navigating Uncertainty and Preparing for the Education Fiscal Cliff

Our guidance includes:

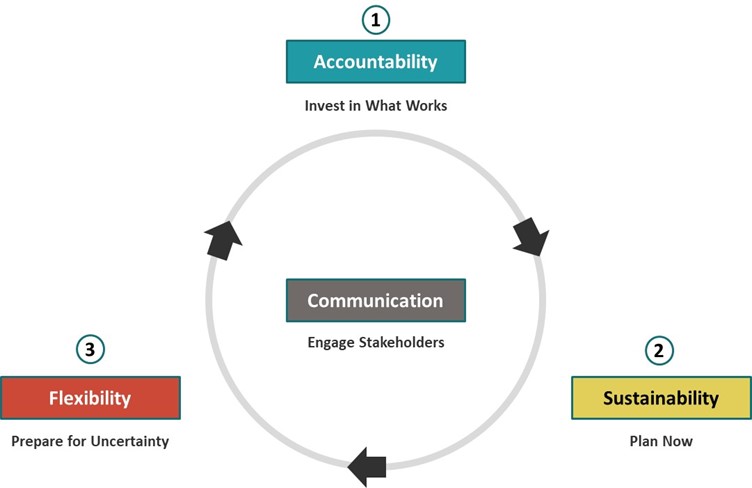
  1. Understand and confront the reality
  2. Engage and empower stakeholders
  3. Identify, invest in, and prioritize what works for students, staff, and families
  4. Plan now for sustainability
  5. Remain flexible to what may change

The first step here is understanding and confronting the reality. This includes developing a multi-year financial forecast to quantify the fiscal problem. Identify and communicate the forces causing a forecasted fiscal deficit, which include:

  • ESSER funds: These federal relief dollars must be obligated by September 2024 and expire thereafter. These funds have been integral to learning recovery investments and providing stability for school systems as much else in the operating environment has been unstable.
  • Economy: Since COVID-19, the cost of facility debt financing has risen while inflation and the corresponding cost of services and personnel has skyrocketed. Uncertain economic forecasts lead to some question about how sufficiently future tax dollars that support state education funding with increase correspondingly
  • Enrollment: NCES forecasts that through 2030, only five states will experience increased public school enrollment. In fact, this year’s tenth grade class is the largest class in the K12 system, and there will be 4% less enrollment in public schools across the nation in 2030 compared to 2019.
  • Talent: According to the IES School Pulse Panel, 53% of public schools reported feeling understaffed entering the 2022-2023 school year. And Teaching vacancies are more prevalent in high-minority schools and schools in high-poverty neighborhoods.

However unjust this circumstance is, we must navigate the situation in student-centered and values-driven ways across stakeholders.

COMMUNICATION: Engage and Empower Stakeholders

Engaging and empowering stakeholders in the change process can provide a meaningful and comprehensive path for determining the appropriate changes for navigating the fiscal cliff.

  • Lead with your values. Set guiding principles for change grounded in your organization’s values. Make communication and engagement commitments you know you can keep.
  • Empower your team. Consider how those most impacted by change and those accountable for spending might lead this change work. How might your finance function inform rather than lead the work to address the fiscal cliff? Identify the roles you want each part of your organization and each stakeholder group to play in operational decision-making.
  • Communicate reality. Change requires buy-in on why it’s necessary. That communication on the problem is critical underpinning before jumping to the solutions. Maintain the discipline to communicate the facts of your current environment. Approach conversations about resources with empathy and transparency. Change requires buy-in on why it’s necessary.
  • Tell the story. Each stakeholder group has a potential powerful role in being the ambassador of your progress story. Leverage your ecosystem and advocacy support.

ACCOUNTABILITY: Know What Works & Prioritize It

  • Identify what works. Identify aspects of your schools and similar schools that are contributing to positive student experience and value for parents and students. Develop and implement a plan to organize your school community to gather and analyze this data.
  • Prioritize. Identify the resource implications – programs, staffing, schedules – of your strategies that are working. Use your remaining one-time funds to support high impact learning recovery investments and non-recurring commitments that you won’t be able to afford in the future. Leverage your stakeholders to identify aspects of your operations that might have to change (levers include school-wide schedules, enrollment, fundraising, cohort sizes, transportation, maintenance schedules, ancillary services, refinancing). Iterate with your financial planning toward finalizing your operating priorities.

SUSTAINABILITY: Plan Now

  • Protect & Grow Revenue. Focus on enrollment: Invest to ensure family engagement is a top priority and a core competency. Take advantage of opportunities to maximize grade level cohorts. Invest in relationships that can lead to fundraising investments.
  • Scenario Plan. Understand potential financial impact of recession on state revenues. Run projections for the years that ESSER funds go away. If you don’t change operations, what is the financial impact on the organization and each school? Build plans for up, base, and down scenarios in enrollment and public funding. Identify targeted opportunities to reduce expenses in downside scenarios.
  • Establish & Reinforce Guardrails. Clarify your school system’s most important financial guardrails – loan covenants, liquidity needs, financing goals, etc. Communicate with key stakeholders your approach to ensuring long-term health of organization while navigating today’s opportunities and challenges.

FLEXIBILITY: Prepare for Uncertainty

  • Monitor financial health. Develop a financial health dashboard and set a cadence for discussion of strengths and risks on at least a quarterly basis. Develop rolling 12-18 month cash flow forecast, as needed.
  • Build Liquidity. Increase your cash target (we recommend >90 days) to provide flexibility in times of high uncertainty. Establish or renew a line of credit or revenue anticipation note. Ensure you’re claiming federal and other grant funding regularly.
  • Stay Scrappy. Limit new ongoing commitments. For example, when possible/reasonable, make strategic one-time investments (contractors, bonuses, etc) to avoid paying for recurring expenses with short-term funds. Consider staging/scaling facilities projects, rather than taking on new debt during a time of elevated cost of financing. Budget conservatively on inflation and per pupil funding assumptions.

Contents of this post were developed in a collaboration of Afton Partners and Charter School Growth Fund.

Deriving Value from ESSA’s Site-Based Expenditure Reporting

Currently in Illinois, as in most states, public education finances are reported at the local education agency (LEA) / school district level. With the implementation of ESSA, school-level expense reporting will be required. ISBE has created an intentional process to make sure the state and its districts not only meet the requirement but find value in it as well.

Arguably, the most critical component of ISBE’s approach has been the creation of a value proposition for site-based expenditure reporting. An advisory group comprised of key stakeholders has been guiding this work from the onset, and co-created the following shared value proposition:

  • Site-level expenditure reporting provides an excellent opportunity for LEAs to maximize care for the whole child, in a whole and healthy school, nested within a whole and healthy community.
  • With site-level expenditure reporting, how resources are allocated will be more readily accessible and revealing to schools and stakeholders.
  • This reporting should ultimately lead to greater equity and improved outcomes for kids: it empowers LEAs and communities to assess and improve equity in funding between individual schools, and it enables a better understanding of the relationship between student outcomes and financial resources.
  • It will also enable LEAs, schools, and the state to identify evidence-based best practices and opportunities to foster innovation between peers.

ISBE is intentionally encouraging local responsibility and dialogue about resource allocation. Notably, because the advisory group identified the value as primarily for LEAs and communities (and explicitly not for the state agency), decisions forming the plan for site-based expenditure reporting have been made through these lenses.

As we get closer to the reporting timeframe in Fall 2019, ISBE and the advisory group have shifted our focus from developing Guidance (or “rules”) for reporting development to helping prepare districts for both completing the reporting and making meaning of it – thereby making strides in realizing the value proposition. Two key mechanisms are enabling this focus, and both are guided by the value proposition: data visualization and training.

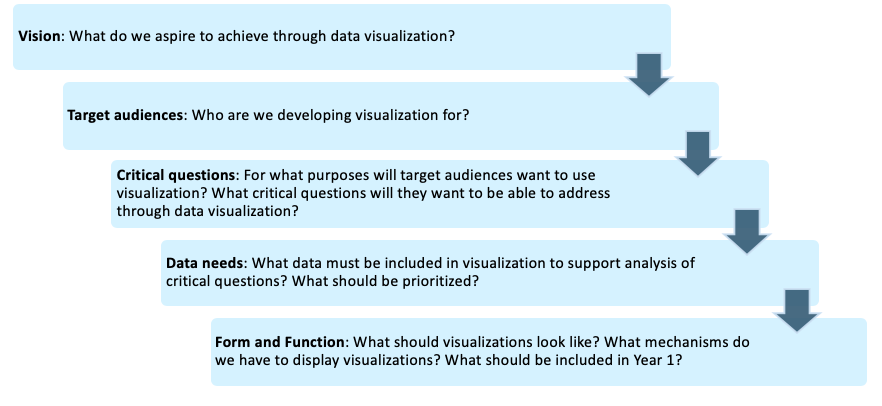
Data visualization is “where the rubber meets the road” for this initiative – where our value proposition comes to life and the data become public, contextualized, and actionable. Our process to create visualizations was intentional, aiming to answer the following questions:

  1. What are the conversations that are aligned with the value proposition that we want to encourage?
  2. What data are necessary to contextualize and inform these conversations?
  3. Among these data possibilities, what should be prioritized for Year 1 Reporting?

ISBE and the advisory group worked through a framework containing a series of exercises to answer these questions. This framework is shown below.

Following this framework allowed ISBE to design draft visualizations grounded in a shared understanding of priorities.

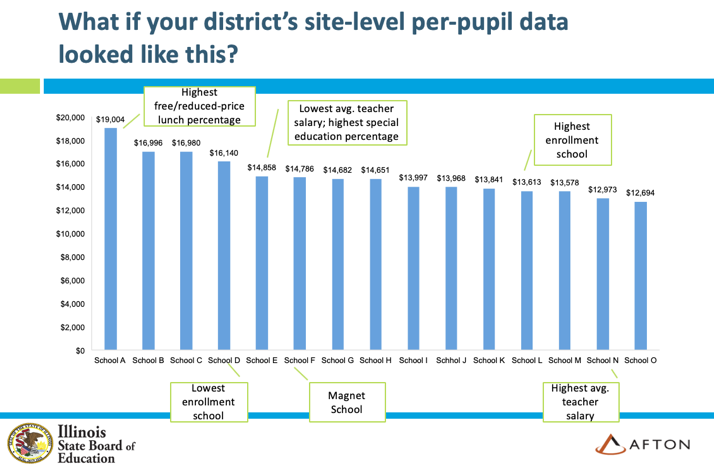
Training is the other critical component enabling LEAs and other local stakeholders to make meaning of site-based expenditure data. ISBE believes district leaders are best positioned to lead their local communities in dialogue about data outcomes and making meaning of the data. While the focus of training can easily default to technical capacity building, our ISBE/Afton team believes that equipping district leaders with the tools necessary to understand what this data is telling them, in order to make informed decisions about future resource planning, is pivotal to the success of this initiative. Consider, for example, the following real data set from an Illinois district (anonymized).

Before this data becomes public through site-based expenditure reporting, ISBE is helping districts prepare to acknowledge the types of questions the data will beg – from themselves, and from other stakeholders. Through thoughtful analysis of site-based expenditure data alongside contextual data on student needs and academic outcomes, the goal is for local leaders to be able to determine if outcomes of resourcing decisions (seen through site-based expenditure data) promote equity and are aligned with their intended strategic priorities. If not, LEAs should be equipped to determine if resourcing decisions should be reevaluated or if strategic priorities should be reevaluated in light of actual data on equity and outcomes. By doing so, we will see meaningful progress toward the value proposition.

For districts considering how to make this new reporting requirement meaningful, regardless of your state’s approach to developing the reporting, Afton recommends the following:

  1. Develop a local value proposition for this data – what does your district and community want to do with the data? For example, evaluate equity, evaluate the relationship between spending and outcomes, or something else?
  2. Facilitate early exploration of your site-based expenditures.
    • What, approximately, has your district been spending by site?
    • Considering contextual data such as student needs and academic outcomes, what can you hypothesize about equity? About the relationship between spending and student outcomes? How can you explore these hypotheses?
    • Are there any intentional changes you may want to make during this year or in anticipation of budgeting for next year?
  3. Suggest Cabinet-level discussions of what the early exploration reveals. Don’t be caught off-guard when data becomes public.
  4. Acknowledge that data, when available, will need to be unpacked and evaluated, and be transparent in the process of doing this.
  5. It may be helpful to form an advisory group of stakeholders to guide this process to ensure community involvement in understanding and making decisions based on the outcomes of this work. At minimum, ensure transparency into the analysis process.

Defining “Principal Autonomy”

For example, a school principal with an innovative instructional delivery idea might earn control over how many of what types of staffing positions their school will operate with (up to a defined cost ceiling) rather than be assigned specific positions by central office. School systems may provide principals with more of these kinds of “autonomies” as levers to improve lower-performing schools, promote innovation, increase hyper-local ownership, and/or for development of strong leaders.

Simply being intentional about assigning specific decision making authorities to school principals and central office can contribute to meeting district-wide and school accountability goals. As noted in the recent publication by Public Impact: “Autonomous District Schools: A New Path to Growing High-Quality, Innovative Public Schools” (full report here), school systems can consider formalizing autonomous relationships with their schools.

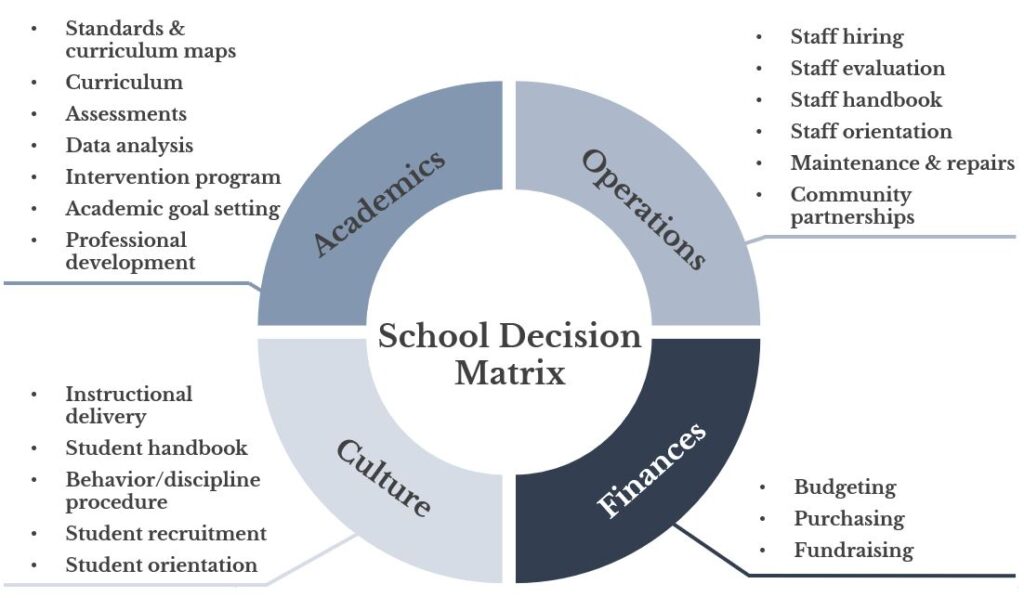
Without clear governance agreements, policies, or other formal establishments of decision making authority guidelines, there may be confusion over responsibilities, making it difficult to effectively oversee school improvement strategies. To get to a clarified view of decision making authority in a school system, consider this example below of a school system’s decisions matrix.

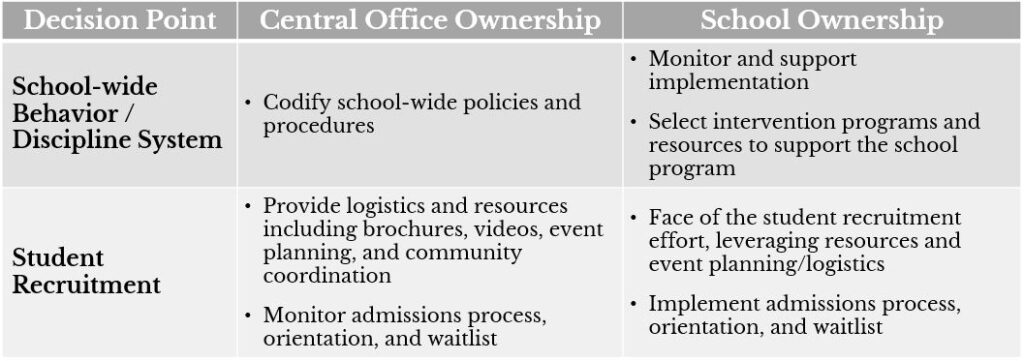
Four major decision categories were identified as Academics, Culture, Operations, and Finance and underneath each category, several types of decision areas were identified. For each of these decision types, the school system identified the role of the central office and the role of schools. Two examples of culture-related decisions and the corresponding roles of central office and principals were articulated as follows:

As school systems define their decision making authorities between schools and central office, they strengthen their ability to implement and oversee school improvements. School systems can take it a step further by aligning financial practices and policies to the decision making authorities. For example, if a school system decides to assign responsibility for student recruitment to school principals, the school system could provide them with the spending authority to repurpose funds toward any number of ideas they may have to recruit students. Compensation and procurement policies could also be reviewed to determine how they might further the implementation of these kinds of autonomy decisions.

After all, how can we reasonably expect district-wide and school improvements without giving clear lines of authority and resource allocation rights to those we ask to be responsible for the results?

Afton Provides Recommendations for State Education Agencies on ESSA Financial Transparency Requirement

In February 2018, Afton Partners joined Edunomics Lab, the Building State Capacity and Productivity Center, and the Council for Chief State School Officers (CCSSO) who hosted a one-day conference for over 30 State Education Agencies (SEAs).

Afton led a session focused on how state agencies can play a role in fostering the usage of per-pupil financial data at the local level. In our session, members of state education agencies took on various roles within a district (teacher, principal, superintendent, parent, etc.) and reviewed a district’s site-level data from the lens of those roles. They looked at the data with questions in mind such as: “What do these data tell you? What more information do you need to play your role effectively?” The small groups convened as “districts” to discuss their data and then presented their site level data to neighboring districts.

Issues raised within the groups included:

  • Equity. Participants pointed to various reasons why school per pupil data within the district could be driven by student-need factors, while acknowledging potential misunderstandings in the community if the data is not communicated properly.
  • Context. Participants noted that more information is needed alongside the expenditure data to “tell the story.” Context such as student demographic information, teacher salary, and school-level outcomes would help in providing context for per pupil spending data.
  • Improvement & Outcomes. Participants recognized how this kind of site-level data can produce value for resource allocation decisions, smart programmatic decisions, and trade-off decisions – given enough contextual data alongside the data.

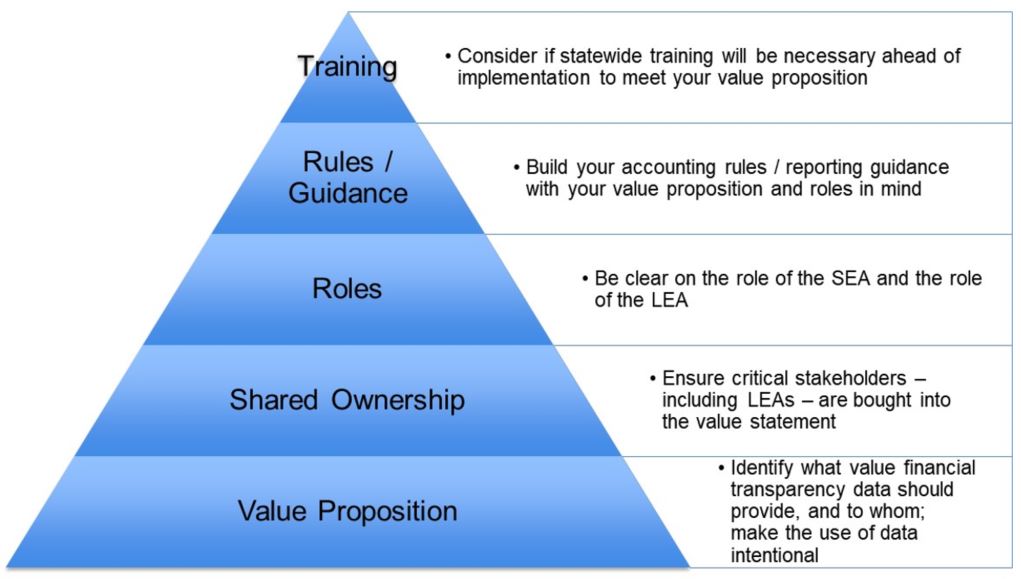
As the group stepped back from playing the role of district stakeholder or staff member, we reflected on the role of State Education Agencies in fostering effective use of school site-based expenditure reporting. Our conclusion was that SEAs can do a lot to encourage effective use of this data, including training, issuing reporting guidance, clearly defining roles/responsibilities between state/local, and leading dialogue on the value of the reporting.

Afton sees the bottom component – value proposition – as a critical grounding mechanism from which all other work on this initiative at both the state and local levels build. Having this stated purpose of the reporting moves the reporting beyond simply a compliance requirement. It guides the way the reporting is developed, visualized, and explained, and focuses efforts to use this data as complementary to other school-level data already available. Afton believes ultimately that site-based expenditure reporting promotes:

  • Transparency. Resource allocation will be more readily accessible to schools and stakeholders
  • Equity. Empowers LEAs and communities to assess and improve equity (and possibly define equity for their community)
  • Outcomes. Enables LEAs and communities to gain a better understanding of the relationship between student outcomes and financial resources
  • Best Practices. Enables LEAs, schools, and the state to identify evidence-based best practices and opportunities to foster innovation between peers

For more information on the ESSA financial transparency requirement:

Afton Leads Discussion on New ESSA Financial Transparency Requirements

Although the US Department of Education has delayed the effective date of ESSA regulations until at least March 21st, States continue to release their draft ESSA plans. Though the federal regulatory framework is in flux, as evidenced by Afton’s session with several SEAs and LEAs, many leading states and Districts continue to support increased transparency and accountability, though identified challenges to address along the way.

The workshop

Afton Partners joined Edunomics Lab, the Building State Capacity and Productivity Center, and the Council for Chief State School Officers (CCSSO) who hosted a one day workshop for more than 100 State Education Agency (SEA) and Local Education Agency (LEA) representatives from nearly 45 different locations, who are leading the effort to ensure their schools are ready to implement and are in compliance to meet the proposed financial transparency reporting requirement in ESSA.

Afton led a session focused on LEA implications, challenges and opportunities stemming from the financial transparency requirements. The leaders from each District identified specific areas of concern or optimism in each of three categories – technical implementation, communications and engagement, and overall impact and outcomes of this reporting.

Technical Implementation

Overall, the area of greatest concern was on technical implementation of the reporting requirement, with general optimism regarding the potential outcomes of this work. The technical challenges ranged from developing, implementing and adhering to a unified expense coding methodology to the potential need for additional capacity to implement. Other concerns included how rural districts would be supported, and potential systems implications.

Communications

The group identified both a set of challenges and opportunities. LEAs saw the benefits of transparency, including opportunities to improve trust and provide a deeper understanding of how districts operate (and the constraints they operate under), but also expressed concern about potential misunderstandings if data is not communicated properly. Overall, the opportunity to engage and communicate with District stakeholders using meaningful, relevant and timely data was viewed positively, with a caveat that planning for the communications effort should start well before the analysis and reporting has been completed.

Outcomes

Impact on outcomes – both academic and financial – was an area of optimism from nearly everyone in the session. The group recognized how this kind of site-level data can produce value for resource allocation decisions, smart programmatic decisions and trade-off decisions.

As the conversation progressed, each district team shared their concerns and how states could help address their most immediate issues. There were a few districts, including those in Rhode Island and Indiana, who have begun to implement site-level reporting and their insights enriched the conversation for others in the planning process. Representatives from Rhode Island shared their experience transitioning to site-level reporting took five years from inception to implementation. It’s important for states and districts to recognize it will take time for a successful shift to meet the new financial transparency reporting requirement under ESSA.

For more information and our site-level per-pupil expenditure analysis, you can view Afton’s presentation “ESSA Financial Transparency: View from the LEA.”